FiberMax case study
A clearer view of every rupee earned, spent and left behind.
Finenza created a custom income and expense dashboard for FiberMax, giving its owner one structured system for reviewing business income, operating costs, household spending and the amount remaining at the end of each period.

The challenge
FiberMax did not have a complete financial reporting system.
Before this project, business income, operating costs and household expenses were tracked separately. This made it difficult to understand the overall financial position in one place.
Where is the money going?
The owner needed to see which business and household categories were absorbing the largest share of available cash.
Is the business genuinely profitable?
Income alone could not show the real position after operating costs and personal commitments were considered.
What remains at the end of the period?
There was no immediate monthly or yearly view of the amount left after all recorded expenses.
Are spending patterns changing?
Without structured history, recurring expenses and developing cost patterns were difficult to recognise.
The solution
The solution was a structured reporting system.
As of July 2026, I use Excel for this type of work, so I built the system in Excel. The owner enters each transaction once. Excel then organises the data, performs the calculations and updates the reports automatically.
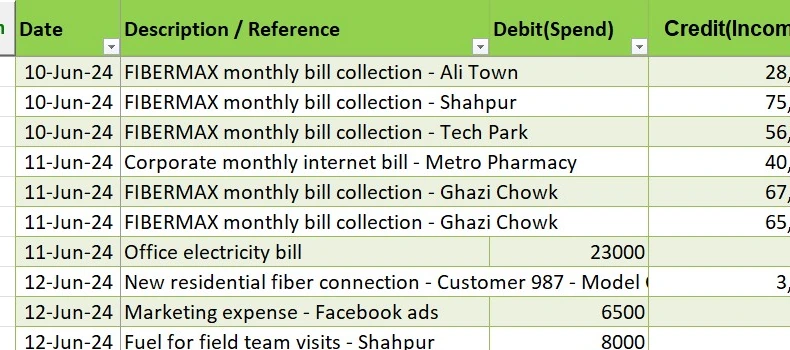
Enter the transaction
The owner records the date, description and either an income or spending amount.
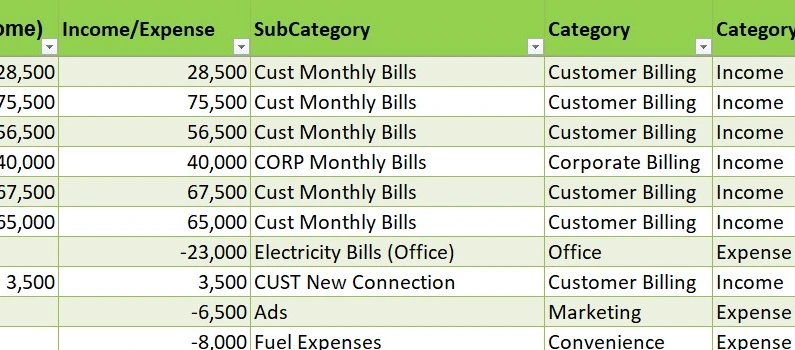
Let Excel complete the structure
The selected subcategory connects the transaction to its main category and income or expense classification.
The workflow
How the system works
The owner records each transaction once. The system then organises the data, updates the calculations and presents the results in reports that can be filtered by year and month.
Enter the transaction
Enter the date, description, amount and subcategory.
Organise the data
Excel automatically assigns the correct category and transaction type.
Update the reports
A single refresh checks the transaction table and updates all calculations, summaries and charts.
Review the results
The owner can filter the reports by year and month to review income, expenses and net savings.
Dashboard walkthrough
Review the overall financial position, then examine the details.
The dashboard first shows income, expenses and net savings. The owner can then filter the report by category, subcategory, year and month to understand the figures in more detail.

Readable close-ups
The complete dashboard establishes the overall layout. These focused views make the important controls and reports readable on phones, tablets and smaller screens.
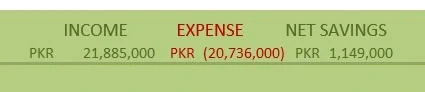
View the financial position
Income, expenses and net savings appear together so the owner can understand the selected period before exploring the detail.
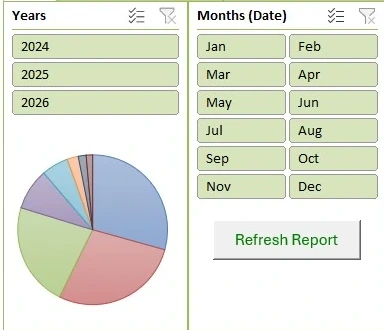
Choose the reporting period
Year and Month slicers let the owner move between annual and monthly views without changing formulas.
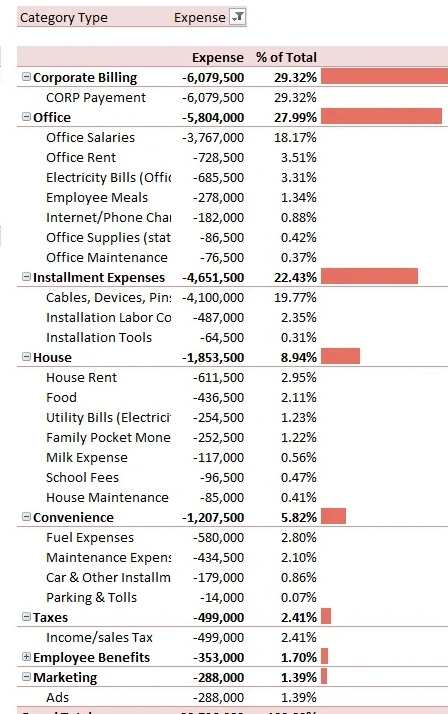
Trace where spending goes
The detailed hierarchy shows category totals, individual expense types and their share of overall spending.
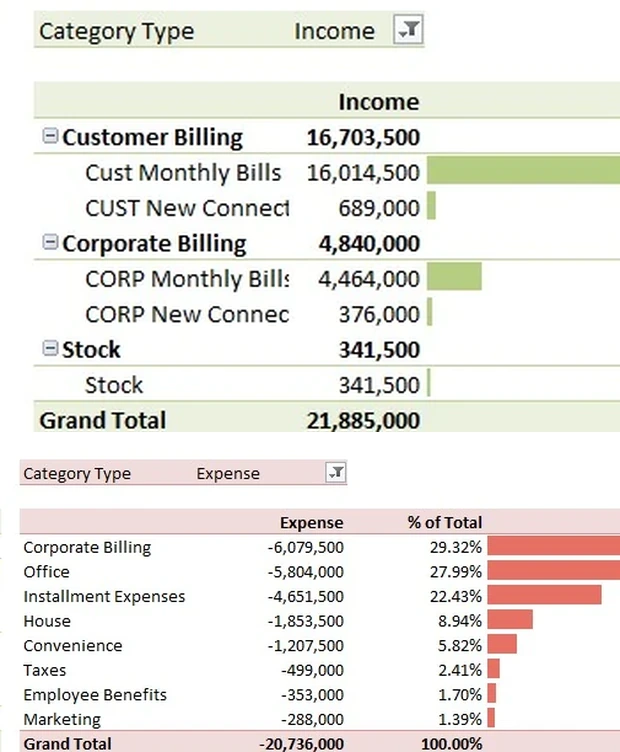
Compare income and expense sources
Category summaries make the main sources of income and the largest expense groups easy to identify.
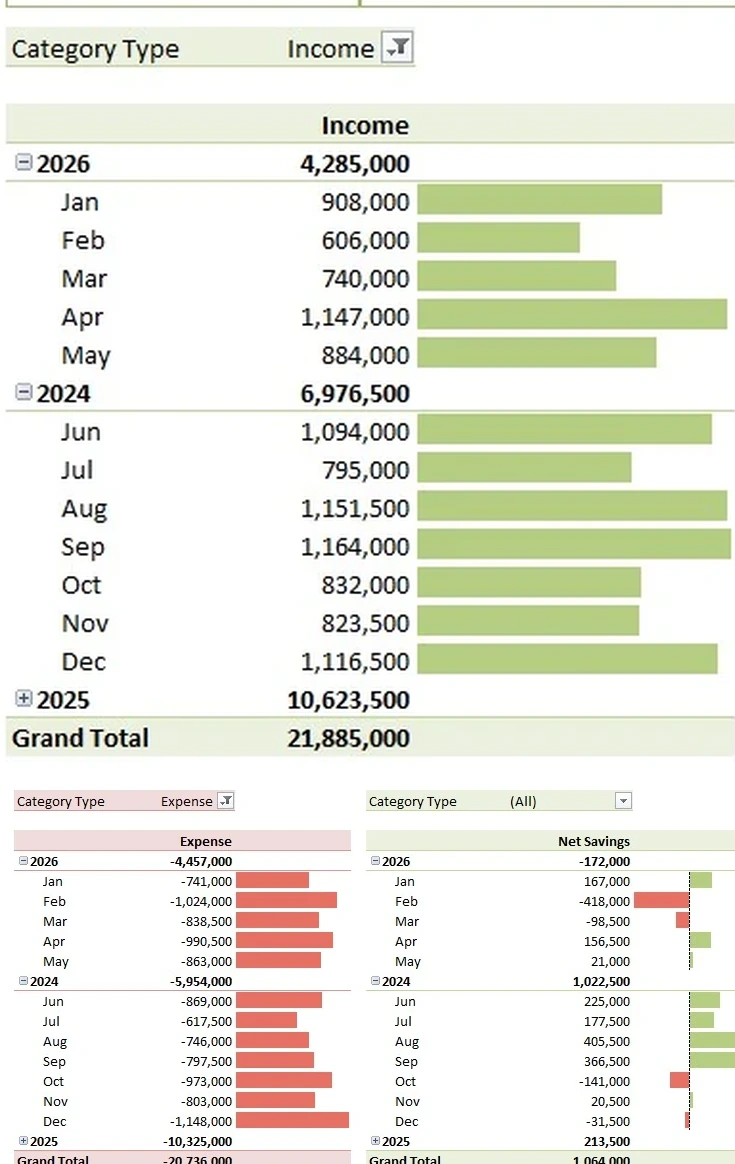
Understand movement over time
Monthly and yearly summaries reveal the trend of income, expenses and the remaining balance as history builds.
User experience
Easy data entry with protected reporting
The owner works mainly inside the Transactions sheet. Excel handles the classification, calculations and reporting while protecting the formulas and report structure.
The owner selects a subcategory, reducing the amount of information that must be entered manually.
Dropdown lists keep category names consistent and prevent spelling differences.
Important formulas and reporting areas are protected from accidental editing.
Categories and subcategories can be updated as the business’s reporting needs change.
Problem solving
Keeping transaction data accurate and reports up to date
The workbook allows the owner to add transactions quickly while protecting formulas, table structure and reporting areas from accidental changes.
Blank rows, incomplete entries and newly added transactions could prevent the reports from updating correctly. The workbook therefore needed a controlled process for adding records, checking data and refreshing the dashboard.
Add New Transaction
The macro temporarily unprotects the sheet, adds a new structured row, clears the user-entry cells, preserves formula columns, places the cursor in the new record and protects the sheet again.
Refresh Report
The refresh process checks for incomplete entries, removes completely blank rows, validates the transaction logic, updates the PivotTables and then restores worksheet protection.
Ten checks run before the report updates.
The refresh process prevents incomplete or invalid transactions from being included in the dashboard.
The automation protects the reporting system from common data-entry errors and ensures that reports update correctly.
Behind the workbook
The workbook uses formulas, reporting tools and automation.
These features organise the data, perform the calculations, update the reports and keep the workbook easy to use.
Structured table
The transaction table expands as records are added and keeps formulas connected to new rows.
Lookup classification
XLOOKUP maps the chosen subcategory to the correct category and transaction type.
Pivot reporting
Multiple PivotTables summarize income, expenses, category performance and time-based results.
Slicers
Year and Month controls provide a simple way to change the reporting period.
Data validation
Controlled dropdown selection helps keep the transaction categories consistent.
Dashboard formulas
Headline results and summaries draw from the reporting layer without exposing calculations.
VBA automation
Macros support safe row creation, input checking, report refresh and worksheet protection.
Locked structure
Calculation and reporting areas remain protected while required controls stay available.
This macro-enabled workbook is designed for the desktop version of Microsoft Excel. Excel 2021 or Microsoft 365 with macros enabled is recommended.
The outcome
A clearer and repeatable financial reporting process
The system brings income, expenses and net savings into one place, making the financial position easier to review each month and year.
Complete financial view
Business income, operating costs, household expenses and net savings can be reviewed in one system.
Clearer spending breakdown
Category summaries show which areas are consuming the largest amounts.
Monthly and yearly reporting
The owner can review a selected month or compare results across different years.
Simple transaction entry
Only four pieces of information are required for each entry.
Easier trend analysis
As more transactions are recorded, changes in income and spending become easier to identify.
Less manual work
The system calculates totals and updates reports, so the owner does not need to combine the figures manually.
Adaptable by design
It is built for FiberMax’s workflow, but it is customizable for other businesses.
The Current System
This version uses manual transaction entry because that matched the client’s existing process. It focuses on monthly and yearly income, expense and net-savings reporting.
Designed for FiberMax around the owner’s actual financial reporting requirements.
The public case study uses fictional data. Actual financial records and personal details are not shown
The workbook structure and automation were designed specifically for FiberMax and are unique.
Custom Excel Systems
Need a better way to track and report your business numbers?
Finenza builds custom Excel dashboards and reporting systems based on how your business records information. The system can help you organise data, monitor performance and make better decisions.
Share your current spreadsheet or reporting problem to discuss a practical solution.